Zeek Home Network Monitoring
Zeek (formerly Bro) is a powerful passive network monitoring tool that generates detailed logs of network activity (HTTP, DNS, SSL, etc.) and configure rules for anomaly detection. If you are a network tinkerer like me, and want to monitor your own home network traffic, Zeek is a great tool to start with. In this blogpost, I'll walk through how I set up Zeek to monitor my home network using a Raspberry Pi and an ASUS router I had lying around.
Hardware Configuration
I use a Raspberry Pi 5 (8GB RAM) to run Zeek and other tools to monitor my network traffic (e.g., I use pi-hole as a DNS sinkhole to block tracking requests). For the crux of the setup, I use the Asuswrt-Merlin firmware on the ASUS router to forward traffic to the Raspberry Pi via iptables. Indeed, a cheap managed switch that can does traffic mirroring (e.g., TP-link TL-SG108E) certainly helps! The only downside is that this is a Layer 3 mirroring, which means it's not a packet-level full mirror (which managed switches may offer), but works if the volume of traffic is not too high (ideal for a small home network). Overall, this approach requires:
- 1x Raspberry Pi 5 (8GB RAM)
- 1x ASUS RT-AC66U router (or any other router that supports flashing custom firmware)
- Some ethernet cables or extra switches/wireless APs if you cant to monitor the entire home network
Network Connections

- Remember to place your original router in bridge mode (this prevents a double NAT situation and allows the ASUS router to control NAT).
- Connect the ASUS router to your modem (in bridge mode) and the Raspberry Pi to the ASUS router via ethernet.
- The Raspberry Pi operates in listen-only mode—it passively monitors network traffic and does not route or process packets.
ASUS Router Configuration
- Install the Asuswrt-Merlin firmware on the ASUS router (Adminstration → Firmware Upgrade → Upload firmware file). I used Asuswrt-Merlin downloads to find the correct firmware (RT-AC68U for my router). Alternatively, I believe you can also use OpenWrt or DD-WRT if you prefer.
- Enable SSH connections to the ASUS router (found in Administration → System).
- Setup iptables rules to forward traffic to the Raspberry Pi IP
address (192.168.50.X). Reboot the router to apply the changes.
>> vi /jffs/scripts/firewall-start #!/bin/sh iptables -t mangle -A PREROUTING -i br0 -j TEE --gateway 192.168.50.X iptables -t mangle -A POSTROUTING -o br0 -j TEE --gateway 192.168.50.X >> chmod +x /jffs/scripts/firewall-start - Verify that the traffic is being forwarded to the Raspberry Pi by
running the following command. You should immediately see the traffic that
isn't addressed to the raspberry pi being forwarded to it.
sudo ip link set eth0 promisc on
sudo tcpdump -i eth0 -n
Zeek Configuration
Follow the Zeek installation instructions to install Zeek for your Raspberry Pi (I used the Debian version for arm64). After installation, I edited the following configuration files:
# /opt/zeek/etc/networks.cfg
# Address ~ Label for the network
192.168.0.0/16 Home network
# /opt/zeek/etc/node.cfg [zeek]
type=standalone
host=localhost
interface=eth0
# /opt/zeek/etc/zeekctl.cfg
# Optional: Configure email notifications for alerts
# and increasing the log rotation interval.
MailTo="email@domain.com"
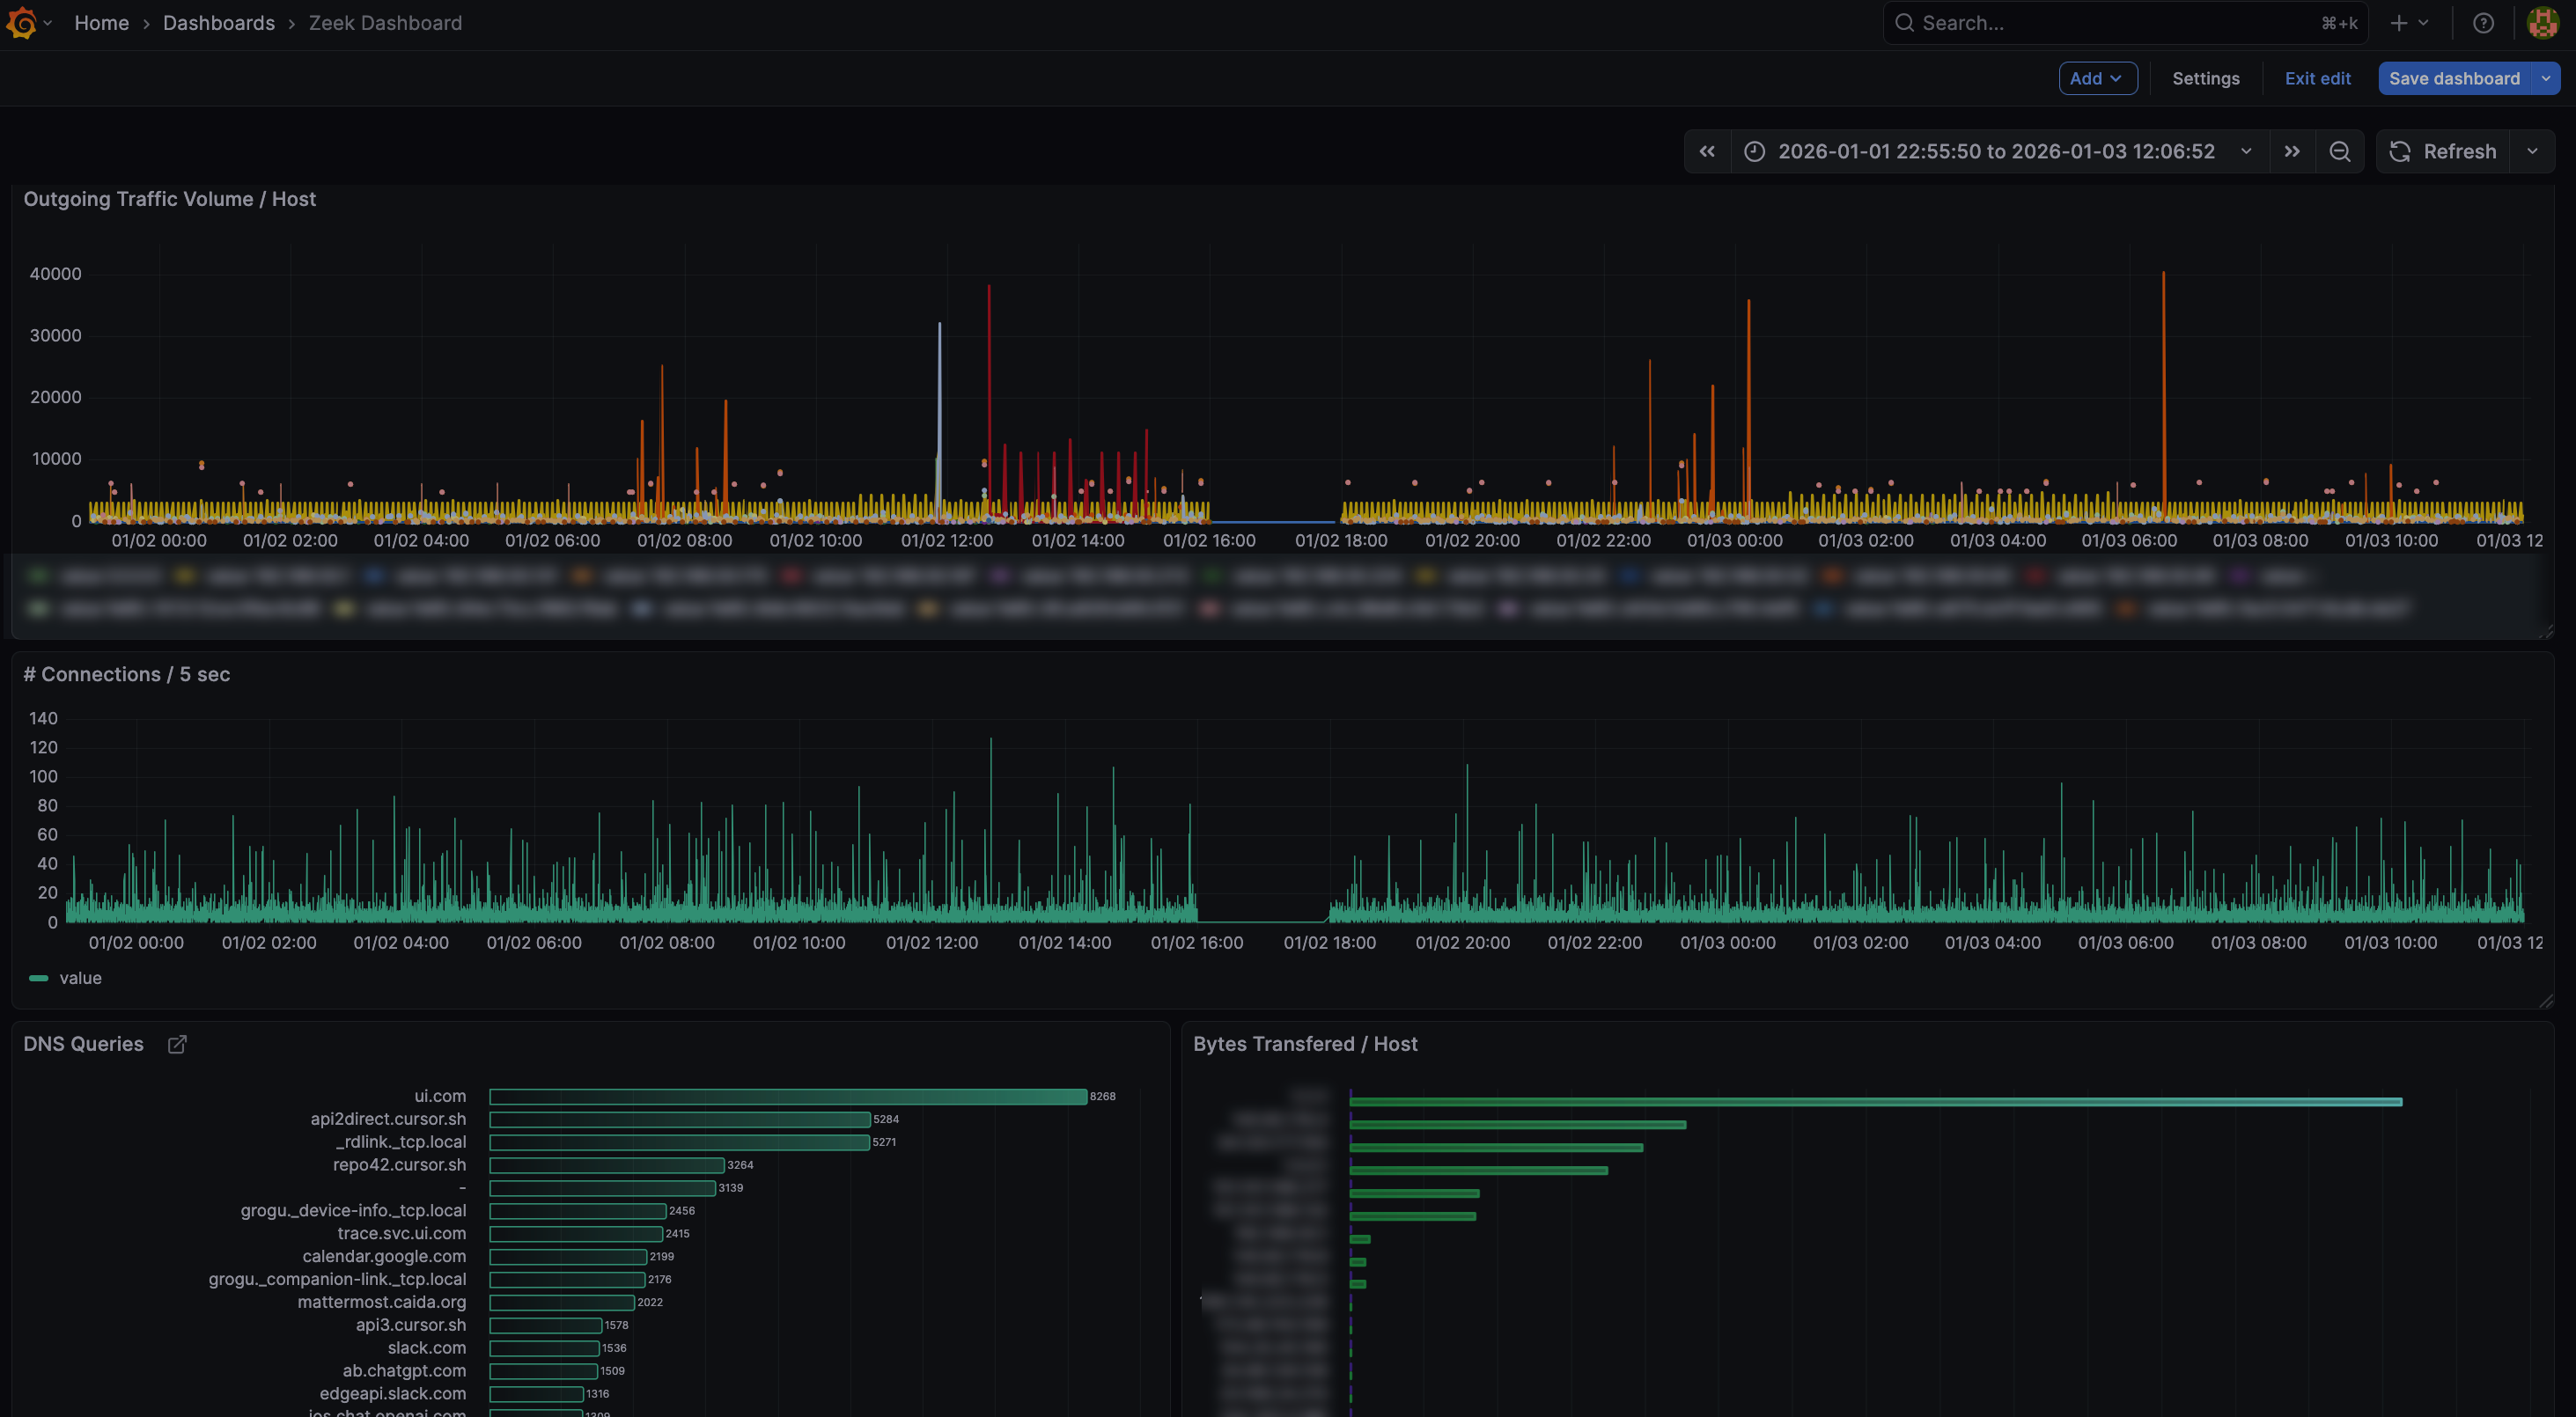
LogRotationInterval = 7200Grafana Dashboard
To visualize the network traffic, I use Grafana installed on the Raspberry
Pi. Firstly,
follow this guide to install Grafana on a Raspberry Pi. Next, you
would want to bootstrap a simple way to ingest the zeek logs to a
database which Grafana can query. I've attached a partly vibe-coded script in
this
repo that converts Zeek logs to a SQLite database for easier querying.
You would want to place this script into a cron job to run periodically
(and I write the default output into
/var/lib/grafana/data/zeek_logs.db). Lastly, Grafana offers
some pre-built dashboards for Zeek (e.g., pcap-did-what),
which I customized to track the metrics I care about most. You can use the
graphana-queries.sql
file to get started.
Event Notifications
There are a lot of things one can do with this setup now. Yacin Nadji (who also uses Zeek for home network monitoring!) has a blogpost on adding Telegram notifications to Zeek. The full blogpost is available at: Telegram Zeek: You're My Main Notice, and also includes how you can trigger custom actions when certain events occur.
What's Next?
At this point, I'm still chasing down packets and trying to understand
what's going on. For example, Apple's ecosystem seems to use mDNS to
broadcast that they exist (e.g., _companion-link._tcp.local,
_airplay._tcp.local). This ultimately led to me learn what
Apple's Bonjour was.
Same goes for Spotify (maybe device discovery is required for their cast
feature?). Shockingly, my Unifi switch seems to call home to ui.com
quite a lot! I'm yet to track down why that is.
Send me a note if you
think there's other interesting ideas to explore here!
References
- Zeek Installation Guide - Official Zeek documentation
- Asuswrt-Merlin Downloads - Custom firmware for ASUS routers
- TP-link TL-SG108E - Managed switch with port mirroring
- zeek-to-sqlite.py - Script to convert Zeek logs to SQLite
- pcap-did-what - Grafana dashboard for Zeek
- graphana-queries.sql - Custom Grafana queries for Zeek
- Telegram Zeek: You're My Main Notice - Blogpost on adding Telegram notifications to Zeek